
Knitters Stitch a Visual Reminder of Climate Change
by
Christina Catanese, Director of Environmental Art, The Schuylkill Center
photos The Tempestry Project
There’s just something about climate change. Despite the fact that predictions grow more dire by the day, it doesn’t feel like an emergency. It can be hard to wrap our minds around something so big and abstract. So how can it become more personal, tangible, visceral?
A group of knitters has one idea: by applying their craft to climate change data.
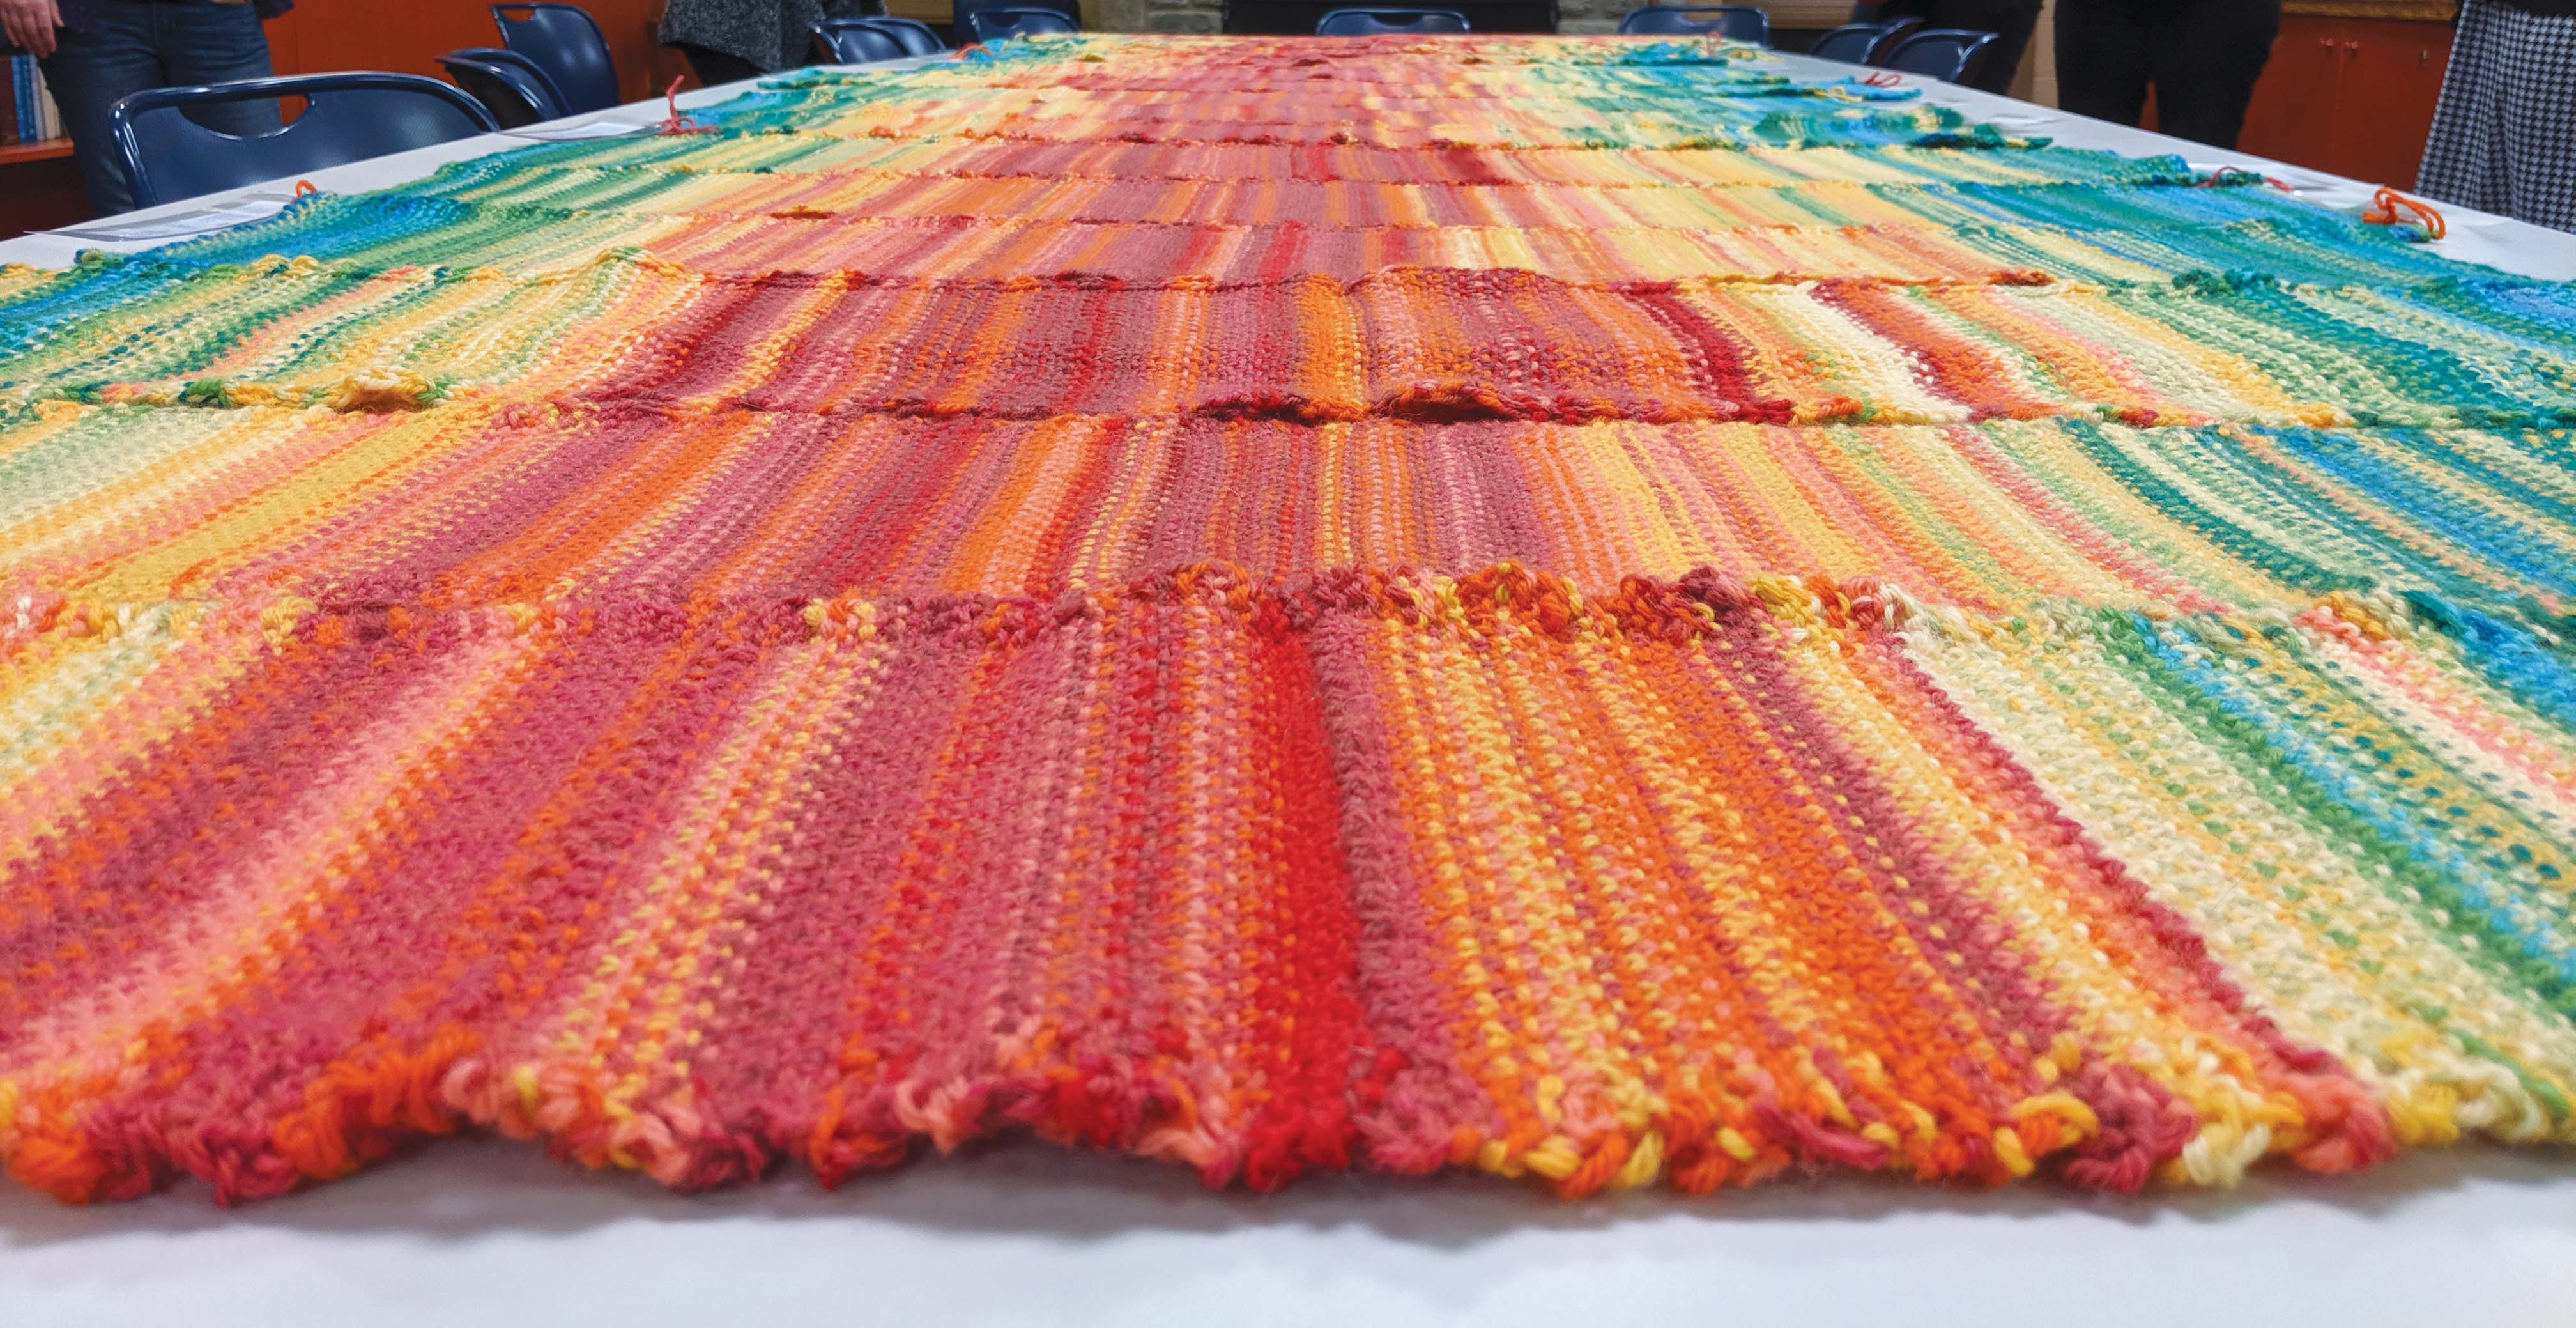
The Tempestry Project is global climate data visualization through fiber arts. A Tempestry is a wall-hanging, or temperature tapestry, that represents the daily high temperature for a given year and location, with January at the bottom and December at the top — think of it like a bar graph. The Tempestry Project was founded by Justin Connelly, Marissa Connelly and Emily McNeil in Anacortes, Wa.
All Tempestries use the same yarn colors and temperature ranges, creating an immediately recognizable and globally comparable mosaic of shifting temperatures over time. If the high temperature is a roasty 96 degrees, the row for that day will be Cranberry, a rich red. If the polar vortex has just come through and the high is just 11 degrees, that row will be Fjord, a cool blue green. (The illustrative names of the yarn colors are an additional delight.)
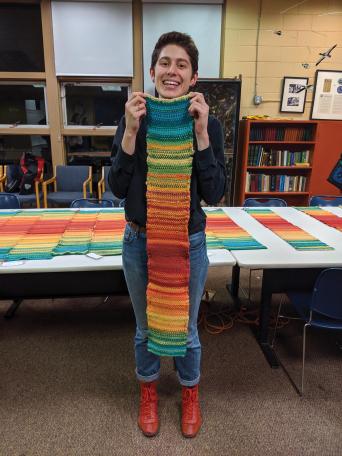
I’m a hybrid science/art person already, plus an avid knitter, so I couldn’t be more excited by this project. I finished my first Tempestry last winter; I chose 2017 in Cooksburg, Pa., the year and place where my husband and I got married. I even knitted in a little silver thread for our actual wedding day; with an 84-degree high, it was a lovely row of Papaya.
People all over the world are making these Tempestries, assembling a global mosaic of shifting temperature patterns, row by wooly row. It’s gratifying to be part of a connected global network of fiber artists putting their energy toward raising awareness, and I found that the mindfulness of knitting and sitting with this global challenge helped me process my own feelings about it.
A single Tempestry is meaningful on its own as a snapshot, a moment in time, a commemoration. But a collection of Tempestries reveals change over time. What if we had a whole slew of Tempestries for one place? Would we visually see the shift, as models predict for Philadelphia, to a hotter, wetter world?
Throughout 2019, the Schuylkill Center coordinated a collection of Tempestries that shows daily maximum temperature data over several years for Philadelphia. I had the pleasure of coordinating 37 volunteer knitters and crocheters from across the region to create this collection, which shows the city’s daily high temperatures every five years from 1875 to 2018. We are lucky to have this nearly 150 years of data collected daily by the Franklin Institute, and maybe even luckier to have so many makers who dedicated their skills and time to memorializing the data in vibrant, colorful yarn. Our monthly climate knitting circle meetings at the Schuylkill Center over the spring and summer were generous, therapeutic, lively gatherings that brought us together to direct our craft toward a cause that mattered to us all.
The collection will be on long-term display at the Schuylkill Center starting in December 2019 to educate about how climate change is impacting our region. A smaller collection with Tempestries spaced every 20–30 years will be available to lend to other organizations for educational purposes and display at events, festivals, or exhibitions.
We’ll be previewing the project at the Philadelphia Museum of Art on Wednesday, Nov. 13, and officially opening the exhibition at the Schuylkill Center on Thursday, Dec. 12. We hope you can join us.